African Savanna- Serengeti Plains
Data Table

Climatogram
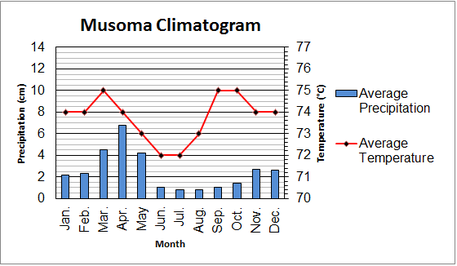
As you can see from the data table and climatogram, the temperature around Musoma (an area close to the Serengeti plains) Serengeti plains is relatively stable over year. The scale distorts the average temperature line, but you can tell from close up that the temperature range is within only 3 degrees on average, which is great for migratory animals to pass through, largely unaffected by the weather.
Another trait of these plains is that there are two essential seasons, a wet and dry season. From November to may, the plains receive a fair amount of precipitation, especially from March to May. But from June to October, it receives barely any precipitation. Of course though, it still rains all year round, but the two main seasons accentuates the migratory pattern.
An interesting thing to note is that the precipitation and temperature both follow a similar curve. During the months of June to August, it is the coolest and has the least precipitation, whereas from November to April, the temperature is a bit warmer, yet there is more precipitation.
A major limiting factor of the Serengeti is the amount of precipitation and food. As you can tell, there is not a significant amount of precipitation throughout the year, yet the Serengeti is supposed to be able to sustain literally millions of animals. The amount of precipitation will not disrupt the migratory patterns, but it can have a significant impact on the population itself. Food, of course, is plentiful, usually, but most of these animals are first level consumers, meaning they rely heavily on the producers. The producers (grasses) are largely dependent on both precipitation and succession due to fire. The nutrients must replenish regularly in order to sustain such a large population.
